archiva.ai
archiva.ai
archiva.ai
Technical documentation that writes itself
Technical documentation that writes itself
Technical documentation that writes itself
ClusterLoop w factors
1
2
3
4
5
6
7
8
9
10
11
12
13
14
15
16
17
18
19
20
21
22
23
24
25
26
27
28
29
30
31
32
33
34
35
36
37
38
39
40
41
42
43
44
45
46
47
48
49
50
51
52
53
54
55
56
57
58
59
60
61
62
63
64
65
66
67
68
69
70
71
72
73
74
75
76
77
78
79
80
81
82
83
84
85
86
87
88
89
90
91
92
93
94
95
96
97
98
99
100
101
102
103
104
105
106
107
108
109
110
111
112
113
114
115
116
117
118
119
120
121
122
123
124
125
/*library statement*/
libname storage '/folders/myfolders/';
proc print data=storage.census_factors (obs=10);
run;
proc standard data=storage.dmefzip replace out=prefactor;
run;
proc sort data=prefactor;
by zipcode;
run;
options pageno=1;
%macro loop (c);
options mprint ;
%do s=1 %to 10;
%let rand=%eval(100*&c+&s);
proc fastclus data=storage.census_factors out=clus&Rand cluster=clus maxclusters=&c
converge=0 maxiter=100 replace=random random=&Rand;
ods output pseudofstat=fstat&Rand (keep=value);
var factor1--factor5;
title1 "Clusters=&c, Run &s";
run;
title1;
proc freq data=clus&Rand noprint;
tables clus/out=counts&Rand;
where clus>.;
run;
proc summary data=counts&Rand;
var count;
output out=m&Rand min=;
run;
data Stats&Rand;
label count=' ';
merge fstat&rand
m&rand (drop= _type_ _freq_)
;
Iter=&rand;
Clusters=&c;
rename count=minimum value=PseudoF;
run;
proc append base=ClusStatHold data=Stats&Rand;
run;
%end;
options nomprint;
%Mend Loop;
%Macro OuterLoop;
proc datasets library=work;
delete ClusStatHold;
run;
%do clus=4 %to 8;
%Loop (&clus);
%end;
%Mend OuterLoop;
%OuterLoop;
proc ggplot data=ClusStatHold;
plot pseudoF*minimum/haxis=axis1;
symbol value=dot color=blue pointlabel=("#clusters" color=black);
axis offset=(5,5)pct;
title "F by Min for Clusters";
run;
title;
quit;
%let varlist=INCMINDX PRCHHFM PRCRENT PRC55P PRC65P HHMEDAGE PRCUN18 PRC200K OOMEDHVL PRCWHTE;
/*descriptive stats for clusters*/
proc sort data=clus610;
by zipcode;
run;
data cluster_vars;
merge clus610 (keep=zipcode factor1--factor5 clus in=a) prefactor (in=b);
by zipcode;
run;
proc print data=cluster_vars (obs=10);
run;
proc summary data=cluster_vars nway;
class clus;
var &varlist;
output out=ClusStats mean=;
run;
proc summary data=cluster_vars nway;
where clus>.;
var &varlist;
output out=OverallStats mean=;
run;
proc print data=clusStats;run;
proc print data=OverallStats;run;
data stats;
set ClusStats
OverallStats
;
run;
proc print data=stats;run;
archiva.ai
Clustering Analysis and Descriptive Statistics for Census Data
Introduction
This code is designed to perform clustering analysis on a census dataset and calculate descriptive statistics for each cluster and overall. It is useful for data preprocessing and targeted marketing strategies.
Code Contents
Set library location for storage
Print first 10 observations of census factors dataset
Standardize data and output to new dataset
Sort data by zipcode
Set option for page number
Create macro to loop through a specified number of clusters
Set option for macro to print
Loop through specified number of clusters
Create outer loop to run through multiple number of clusters
Delete previous dataset
Merge datasets and calculate descriptive statistics for each cluster
Print first 10 observations of merged dataset
Calculate overall descriptive statistics for all clusters
Merge overall and cluster statistics
Print merged dataset
View code
How Archiva works
How Archiva works
How Archiva works
Connect & Stay updated
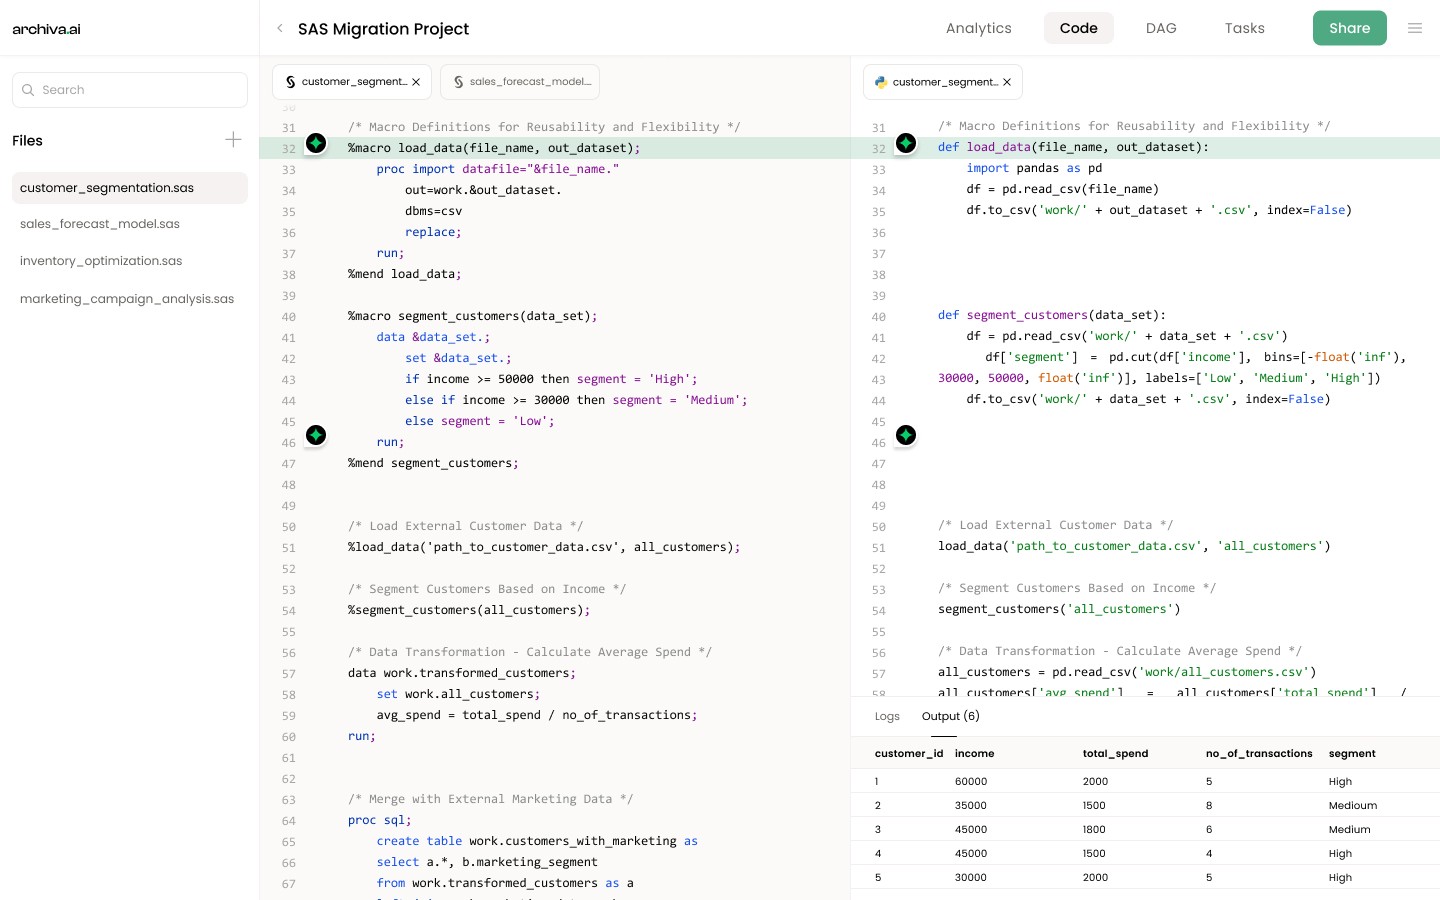
Simply connect your SAS codebase to Archiva. Watch your documentation update automatically with every commit, ensuring it's always in sync with your code.
AI-powered analysis
Archiva's AI analyzes your code line-by-line, writing detailed technical documentation for every change.
Deep code understanding
Leveraging data lineage, code statistics, and your system's specifics, Archiva generates accurate technical documentation.
Interactive exploration
Ask Archiva anything about your code and data connections..

The future of analytical codebases' documentation
The future of analytical codebases' documentation
The future of analytical codebases' documentation
Effortless collaboration
Share clear and up-to-date documentation with your entire research team, fostering collaboration and knowledge transfer.
Error-free & consistent docs
Eliminate human error in documentation. Archiva ensures consistent updates and formatting, capturing every detail of your code.
Expert oversight
Review and refine documentation generated by Archiva. Maintain complete control with the option to manually override when needed.
More time for research
Free yourself from tedious documentation tasks. Archiva saves you time and allows you to focus on scientific breakthroughs.
Unlock the secrets of your codebase
Unlock the secrets of your codebase
Unlock the secrets of your codebase
Get a free trial and experience effortless code documentation whether you're a large enterprise or a growing startup.
Get a free trial and experience effortless code documentation whether you're a large enterprise or a growing startup.
Get a free trial and experience effortless code documentation whether you're a large enterprise or a growing startup.
